In the vast landscape of statistical analysis, the Student’s T-Test emerges like a compass, deftly guiding researchers through the murky waters of hypothesis testing. Much like a pastry chef perfecting a soufflé, this test requires precision, a keen eye for detail, and an understanding of the subtleties that can make or break an experiment’s outcome.
Imagine two different recipes: one for a rich chocolate cake and another for an airy coconut meringue. Both are delectable, yet they require distinct approaches to achieve the desired result. Similarly, the Student’s T-Test helps researchers determine whether the means of two groups differ significantly, providing clarity in the ongoing quest for empirical truth.
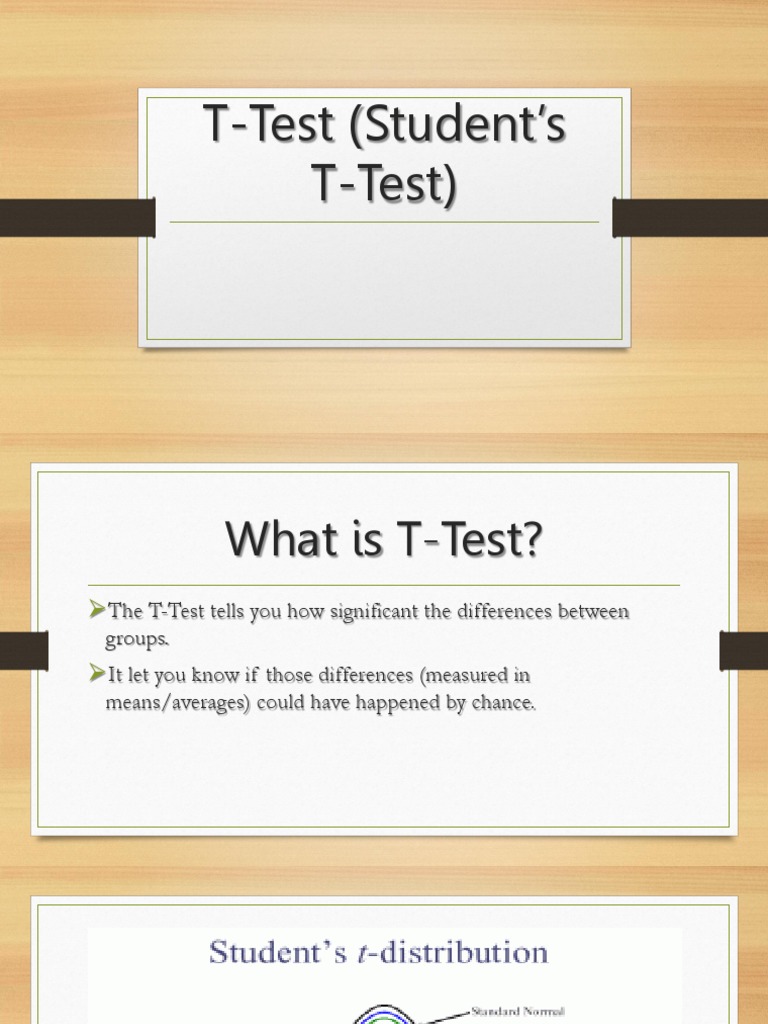
### What is the Student’s T-Test?
The Student’s T-Test is a statistical method used to ascertain if the means of two groups are statistically different. Originating from the need for an efficient means of analyzing small sample sizes, this test serves as a vital tool for researchers across various fields including psychology, medicine, and market research. Its namesake, William Sealy Gosset, under the pseudonym “Student,” revolutionized the way we process and interpret small samples.
Just as a maestro directs a symphony, harmonizing diverse instruments, the T-Test orchestrates the comparison of groups, allowing for a clearer understanding of the relationships at play. Whether testing the efficacy of a new drug or comparing teaching methods, each application is a note in the grand melody of scientific inquiry.
### Types of T-Tests
Like the distinct flavors in a gourmet dish, the Student’s T-Test encompasses a variety of forms to suit the researcher’s needs:
- Independent T-Test: This version assesses the means of two independent groups. Picture a duel between two equally matched wrestlers; their performances can be compared to determine who triumphs, based solely on their individual prowess.
- Paired T-Test: Unlike its independent counterpart, this test evaluates means from the same group at different times—imagine a before-and-after scenario where the effects of a new intervention are scrutinized, revealing profound changes over time.
- One-Sample T-Test: This test compares the mean of a single group against a known value. It’s akin to evaluating whether your homemade chili is spicier than the legendary Texas recipe; the known value acts as the benchmark against which you’ll measure your culinary prowess.
Each variation of the T-Test ensures that the researcher selects the appropriate tool for their specific investigative endeavor, enhancing the robustness of their analysis.
### Understanding the T-Test Formula
The formula for the T-Test resembles a mathematical recipe, with numerous ingredients that contribute to the final outcome:
T = (M1 – M2) / (s_p * √(1/n1 + 1/n2))
In this equation:
- M1 and M2 represent the means of the two groups being compared, similar to the varying quantities of flour and sugar in two cake recipes.
- s_p is the pooled standard deviation, a measure of the variation within each group, akin to the richness of flavors that emerge when all the ingredients meld harmoniously.
- n1 and n2 are the sample sizes of each group. Greater sample sizes often yield more reliable results, just as a larger audience can enhance feedback on a theatrical performance.
This mathematical formulation reveals the delicate balance between group means and variability, illuminating the path to informed conclusions.
### Practical Application: A Hypothetical Example
To illustrate the application of the Student’s T-Test, consider a study examining the effects of a new academic tutoring program on student performance. Researchers select two groups of students—one that undergoes the program and another that does not. After a semester, both groups take the same standardized test.
The independent T-Test can be employed here to determine whether the average test scores of the two groups are statistically different. This scenario is akin to pitting two garden varieties against each other; the researchers seek to uncover which approach yields a more bountiful harvest of knowledge.
With test scores in hand, the researchers calculate the means and standard deviations for both groups, applying the T-Test formula. Upon executing this analysis, they discover a T-value that turns the tide of their inquiry.
Should the resulting p-value fall below the established threshold (often 0.05), the researchers may conclude that the tutoring program tangibly improved academic performance—an insight that could inspire changes in educational policy.
### Benefits and Limitations of the T-Test
Every tool bears advantages and disadvantages, and the Student’s T-Test is no exception. Its principal benefits include:
- Simplicity and Accessibility: The T-Test is relatively easy to comprehend and execute, allowing researchers across disciplines to adopt it with minimal prerequisites.
- Small Sample Handling: Ideal for studies involving small sample sizes, making it particularly valuable when gathering data is challenging or resource-intensive.
However, researchers must also navigate its limitations:
- Assumptions of Normality: The T-Test assumes that the data follows a normal distribution, a prerequisite that may not hold true in every study.
- Equal Variances: The test assumes homogeneity of variances, which if violated can lead to erroneous conclusions.
In closing, the Student’s T-Test serves as a beacon, illuminating the path through the intricate tapestry of statistical analysis. Its versatility and accessibility empower researchers to investigate myriad questions across disciplines, akin to the ubiquitous nature of the beloved chocolate cake—always promising a delectable slice of understanding. Whether navigating small samples or deciphering complex relationships, the Student’s T-Test remains a quintessential tool in the arsenal of statistical inquiry.