The world of statistics is rich with concepts that help elucidate the mysteries of data. Among these concepts, the null hypothesis and the alternative hypothesis hold paramount importance. They anchor the framework of hypothesis testing, a method used to draw conclusions about populations based on sample data. In this article, we will delve into the nuances of these hypotheses, exploring a concrete example to unravel their practical applications and significance.
At its core, a hypothesis is a statement that posits a relationship between variables. This relationship can be either a simple correlation or a more complex causal link. In hypothesis testing, two competing hypotheses are formulated: the null hypothesis (H₀) and the alternative hypothesis (H₁ or Ha). The null hypothesis serves as a default position that indicates no effect or no difference, while the alternative hypothesis suggests that there is an effect or a difference that needs to be explored.
To illustrate this dichotomy, let’s consider a commonly observed phenomenon: the effects of a new study program on student performance. Imagine a high school that implements an innovative educational curriculum aimed at enhancing student achievement. The school’s principal wishes to determine whether this new program is effective in improving test scores when compared to the traditional curriculum. Here’s how the hypotheses would be structured:
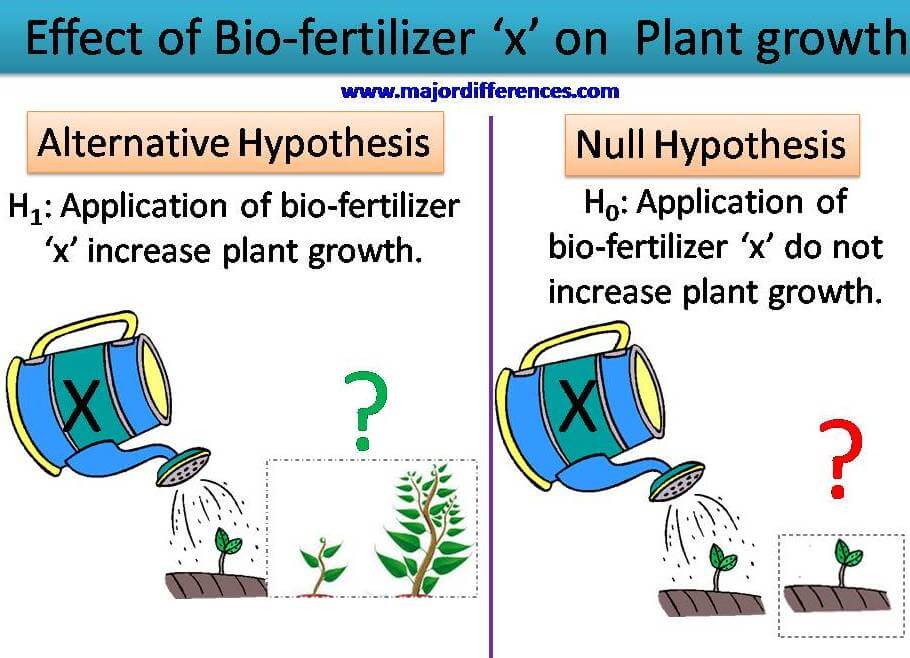
Null Hypothesis (H₀): The new study program has no effect on students’ test scores compared to the traditional curriculum. In statistical terms, this can be expressed as:
H₀: µ₁ – µ₂ = 0, where µ₁ is the mean test score of students in the traditional program and µ₂ is the mean test score of students in the new program.
Alternative Hypothesis (H₁): The new study program does have an effect on students’ test scores. This can be articulated as:
H₁: µ₁ – µ₂ ≠ 0, indicating that there is a statistically significant difference between the two groups’ mean scores.
Once these hypotheses are established, the next phase involves collecting and analyzing data. Suppose the school conducts a study where it evaluates two groups of students: one that underwent the traditional curriculum and another that has been introduced to the new program. After administering the same standardized test to both groups, the educators can gather the scores and calculate the respective means.
Now, the essence of hypothesis testing lies in determining the likelihood that the observed differences in test scores could have occurred by chance if the null hypothesis were true. This is generally accomplished through statistical tests, such as t-tests or ANOVA, depending on the complexity and structure of the data. By computing a p-value, researchers can assess whether the null hypothesis can be rejected in favor of the alternative hypothesis.
If the p-value is lower than a predetermined significance level, often set at 0.05, statisticians may declare that they have sufficient evidence to reject the null hypothesis. In our example, if the results indicate a statistically significant improvement in test scores for students in the new program, it leads to the exciting initialization of the alternative hypothesis: that the new curriculum impacts student learning positively.
However, the journey does not end there. A fascinating aspect of understanding hypotheses is acknowledging the implications of Type I and Type II errors. A Type I error occurs when the null hypothesis is incorrectly rejected when it is actually true. In our educational scenario, this would mean concluding that the new program is effective when, in reality, it is not. Conversely, a Type II error occurs when we fail to reject the null hypothesis when the alternative hypothesis is true, mistakenly concluding that there is no difference when a significant effect actually exists.
These errors compounding the complexity of hypothesis testing, illuminate deeper reasons why understanding statistical inference is crucial in various disciplines, from education to medicine and beyond. The potency of these hypotheses lies in their ability to guide decision-making and influence policy implementations. For instance, if the new educational curriculum is proven ineffective, the school may decide to invest resources elsewhere, thereby avoiding wasted efforts and funds.
Beyond the numerical values and statistical computations, there is an intrinsic fascination tied to the broader implications of the hypotheses. Each null and alternative hypothesis not only serves a mathematical purpose; they also encapsulate the essence of questioning and inquiry. In a world inundated with information, dissecting and testing assumptions becomes a means to navigate uncertainty and drive progress.
Engaging with the concept of null and alternative hypotheses can inspire critical thinking and skepticism. They foster a culture where ideas are continuously evaluated and re-evaluated, enabling a dynamic flow of knowledge and innovation. This iterative process is the crux of scientific inquiry, echoing the age-old pursuit of truth.
In conclusion, the interplay between null and alternative hypotheses is fundamental in understanding how we analyze and make inferences from data. The example centered on student performance illustrates the practical application of hypothesis testing and its broader significance. The ability to discern the profound differences and implications of various educational initiatives can lead to more informed decisions in school systems. As we continue to explore this fascinating landscape of statistics, let us embrace the spirit of inquiry that drives us to question, test, and discover our world.